(close this window to return to the Performance page)
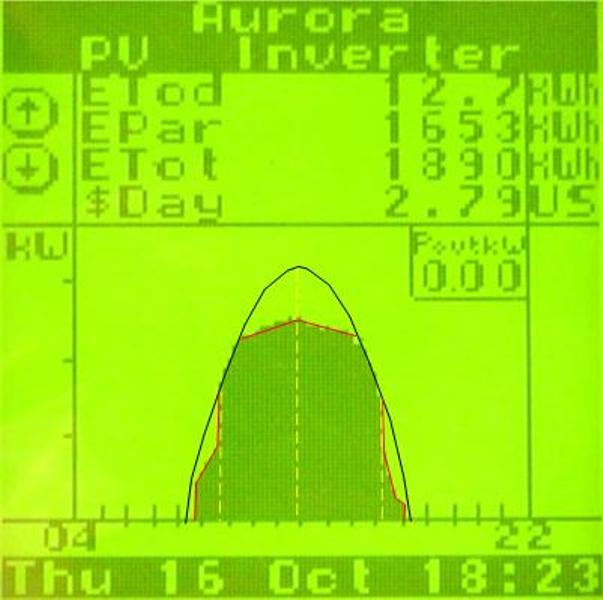
- The red lines in this image show the actual energy generated during a cloudless day in early autumn.
- The dashed yellow lines (from left to right) indicate 9:30am (when the shadow of the dormer left the panels on the west side), 1pm (when the sun was due south), and 4:30pm (when the tree's shadow reached the roof).
- The black curve represents my theoretical estimate of the energy that could have been generated under ideal, unshaded conditions.
Summary:
| Condition | Energy | Percent of
Theoretical |
| Theoretical | 15.4 kWh | 100% |
| Actual | 13.0 kWh | 84.5% |
Dormer Shading
(morn + eve) | 0.9 kWh | 6.1% |
| Maple Tree Shading | 0.0 kWh | 0.2% |
| Flat-top Effect | 1.4 kWh | 9.2% |