Overall Performance
")
Lifetime Generation: 25070 kWh (as of 7/27/2014)
[–] compress
[+] show all
Actual
Monthly
Statements |
|
2008  |
Energy
Generated
(kWh) | Energy
Consumed
(kWh) |
Generated
Consumed
(%) |
| Jan-Feb | --- | --- | -- |
| Feb-Mar | --- | --- | -- |
| Mar-Apr | --- | --- | -- |
| Apr-May | --- | --- | -- |
| May-Jun | --- | --- | -- |
| Jun-Jul | 438 | 472 | 93 |
| Jul-Aug | 392 | 529 | 74 |
| Aug-Sep | 419 | 467 | 90 |
| Sep-Oct | 317 | 371 | 85 |
| Oct-Nov | 308 | 310 | 99 |
| Nov-Dec | 178 | 369 | 48 |
| Dec-Jan | 128 | 466 | 27 |
| Summary | 2180 | 2984 | 73 |
|
[–] 2009  |
E
Gen
(kWh) | E
Con
(kWh) |
Gen
Con
(%) |
| 308 | 369 | 83 |
| 322 | 392 | 82 |
| 394 | 361 | 109 |
| 460 | 360 | 128 |
| 409 | 313 | 131 |
| 480 | 543 | 88 |
| 486 | 265 | 183 |
| 345 | 351 | 98 |
| 301 | 353 | 85 |
| 232 | 305 | 76 |
| 166 | 340 | 49 |
| 140 | 431 | 32 |
| 4043 | 4383 | 92 |
|
| [–] 2010 |
E
Gen
(kWh) | E
Con
(kWh) |
Gen
Con
(%) |
| 231 | 340 | 68 |
| 272 | 341 | 80 |
| 445 | 299 | 149 |
| 437 | 326 | 134 |
| 460 | 401 | 115 |
| 437 | 606 | 72 |
| 407 | 502 | 81 |
| 471 | 553 | 85 |
| 391 | 339 | 115 |
| 336 | 447 | 75 |
| 206 | 906 | 23 |
| 179 | 936 | 19 |
| 4272 | 5996 | 71 |
|
| [–] 2011 |
E
Gen
(kWh) | E
Con
(kWh) |
Gen
Con
(%) |
| 190 | 857 | 22 |
| 230 | 691 | 33 |
| 376 | 616 | 61 |
| 362 | 456 | 79 |
| 404 | 462 | 87 |
| 401 | 498 | 81 |
| 443 | 505 | 88 |
| 493 | 476 | 104 |
| 358 | 332 | 108 |
| 281 | 524 | 54 |
| 224 | 706 | 32 |
| 205 | 653 | 31 |
| 3967 | 6776 | 59 |
|
| [–] 2012 |
E
Gen
(kWh) | E
Con
(kWh) |
Gen
Con
(%) |
| 208 | 419 | 50 |
| 304 | 368 | 83 |
| 450 | 438 | 103 |
| 356 | 375 | 95 |
| 580 | 376 | 154 |
| 485 | 520 | 93 |
| 410 | 489 | 84 |
| 463 | 426 | 109 |
| 403 | 352 | 114 |
| 258 | 415 | 62 |
| 243 | 482 | 50 |
| 205 | 542 | 38 |
| 4365 | 5202 | 84 |
|
| [–] 2013 |
E
Gen
(kWh) | E
Con
(kWh) |
Gen
Con
(%) |
| 152 | 398 | 38 |
| 274 | 406 | 67 |
| 410 | 439 | 93 |
| 401 | 465 | 86 |
| 362 | 367 | 99 |
| 423 | 528 | 80 |
| 437 | 388 | 113 |
| 451 | 521 | 87 |
| 395 | 350 | 113 |
| 236 | 593 | 40 |
| 217 | 570 | 38 |
| 93 | 197 | 19 |
| 3851 | 5522 | 70 |
|
| [–] 2014 |
E
Gen
(kWh) | E
Con
(kWh) |
Gen
Con
(%) |
| 176 | 458 | 38 |
| 421 | 467 | 90 |
| 361 | 506 | 71 |
| 398 | 463 | 86 |
| 468 | 402 | 116 |
| 392 | 452 | 87 |
| --- | --- | -- |
| --- | --- | -- |
| --- | --- | -- |
| --- | --- | -- |
| --- | --- | -- |
| --- | --- | -- |
| ---- | ---- | -- |
|
- This is a parallel-metered system, so my utility company records the actual amount of energy generated in each monthly statement period, regardless of how much energy I consume. (My meters are read in the middle of the month, so each statement period covers some of one month and some of the next month.)
- The Energy Generated and Energy Consumed values listed in the table are as reported to me by the utility company in my monthly statements.
- Generaged / Consumed is a simple ratio, indicating what percentage of my energy usage was generated by the solar panels.
- The lifetime value is as shown on the meter, which records all energy generated since the system went online on 6/09/08.
- We installed a geothermal heating/cooling system on 7/16/10. This is a more efficient way to heat and cool a house; although the summertime months will show lower consumption, the wintertime months will show higher electrical consumption, but this is offset by the lower natural gas consumption. The net effect of this energy trade-off is tracked on the geothermal site's Performance page.
Typical Performance
Some days I read the two meters at the same time each morning to gather some data regarding a typical day. This is useful for learning the effects of things such as daily weather variation.
Typical
Day (kWh) |
Jun/Jul
2008 | Sep/Oct
2008 |
Dec/Jan
2008/09 | Mar/Apr
2009 |
Jun/Jul
2009 | Sep/Oct
2009 |
Dec/Jan
2009/10 | Mar/Apr
2010 |
Jun/Jul
2010 | Sep/Oct
2010 |
Dec/Jan
2010/11 |
Energy generated
(sunny day) |
17-18 | 15-17 | 11-14 | 21-24 | 18-21 | 19-20 | 10-15 | 18-22 | 18-20 | 15-20 | 13-15 |
Energy generated
(average day) |
14.0 | 10.5 | 4.6 | 13.7 | 13.9 | 11.2 | 4.7 | 14.8 | 14.1 | 12.6 | 5.0 |
Energy consumed
(average day) |
16.1 | 12.7 | 13.2 | 12.6 | 14.7 | 11.2 | 12.0 | 11.0 | 17.6 | 12.7 | 31.3 |
Energy consumed
(AC and geo off) |
10-14 | 9-13 | 10-15 | 9-15 | 9-16 | 9-14 | 9-16 | 9-15 | 9-14 | 9-13 | n/a |
Energy consumed
(with AC or geo on) |
23-36 | n/a | n/a | n/a | 25-35 | n/a | n/a | n/a | 18-36 | n/a | 32-41 |
- The air conditioner was a huge energy hog in the summer, so we replaced it with a geothermal system in late July 2010. This reduces our electricity usage for summer cooling, and it reduces our gas usage for winter heating, but it increases our electricity usage for winter heating. We're still adjusting the system for optimal winter performance, but the winter 2010-2011 numbers are much higher for this reason.
- In the autumn the amount of sunlight we're receiving on a sunny day is still pretty high, but there are much fewer sunny days than in the summer, so average generation is noticeably lower.
- In the winter we still generate a decent amount of energy on a sunny day, but there are a lot fewer sunny days. Also, we generate little or nothing for a day or two after each snowfall until the panels melt clear.
- The amount of sunlight received in spring should be about the same as we receive in autumn, but we generated much more electricity in Spring 09 than Autumn 08, because the inverter calibration problem was fixed in November 08.
- The average energy consumed in Summer 09 was lower than Summer 08, because we were out of town for several weeks, so we turned off our air conditioner during some of the hottest days.
- Summer 10 was hotter and rainier than normal, so generation was low and consumption was high.
Daily Performance
Other than weather variations, daily performance is affected by shading. When the sun rises/sets far enough to the north, the dormer in the center of the roof shades the west side in the early morning and the east side in the late afternoon. When the sun is in the west, the mature maple tree in the backyard shades the whole roof. When the sun rises/sets farther south, the dormer and maple tree aren't an issue, but the pine tree in the neighbor's backyard provides some afternoon shade.
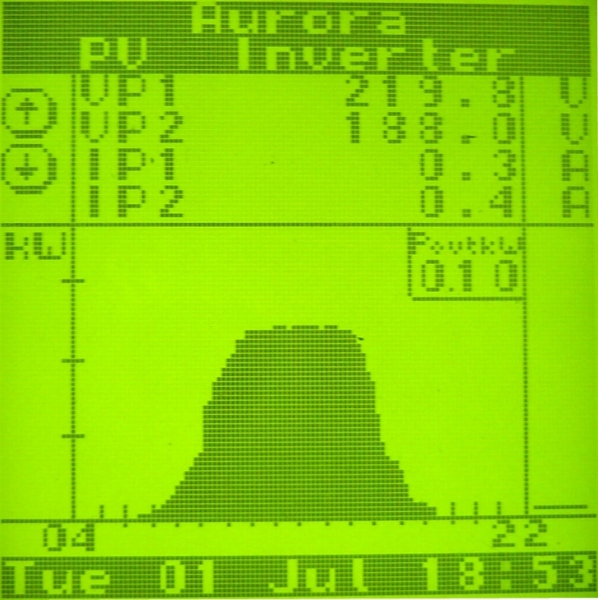
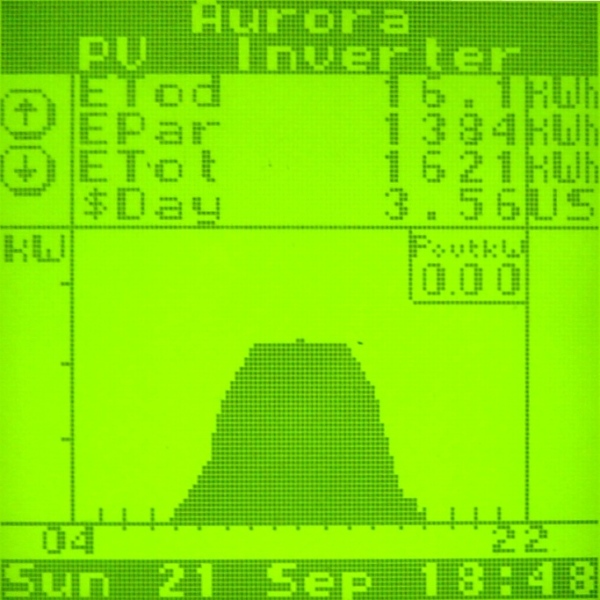
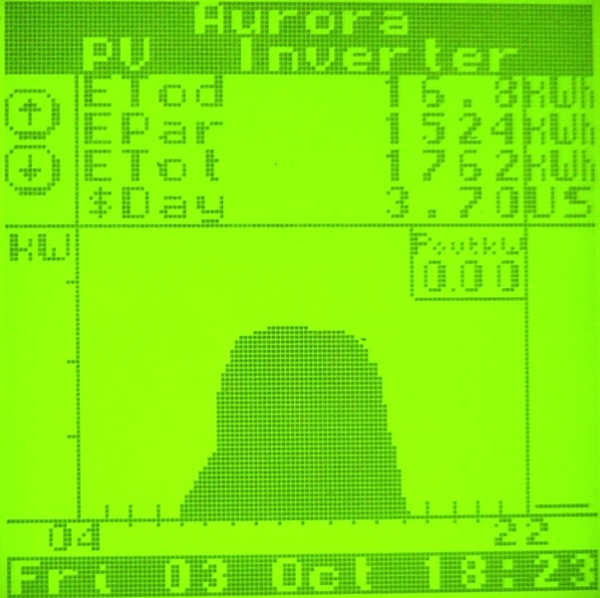
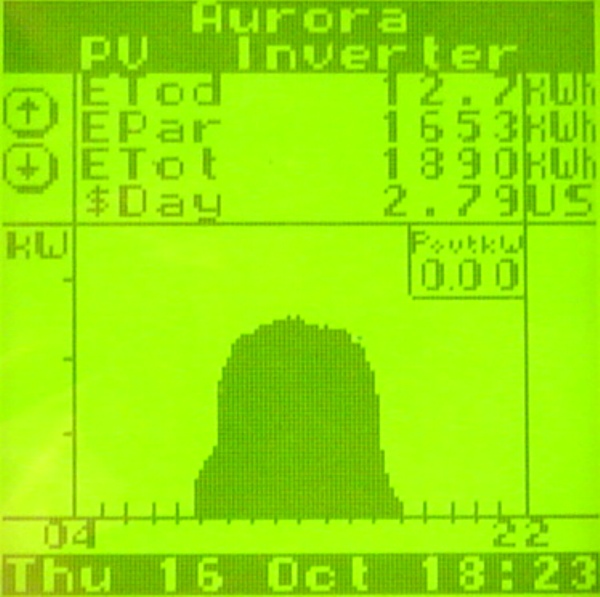
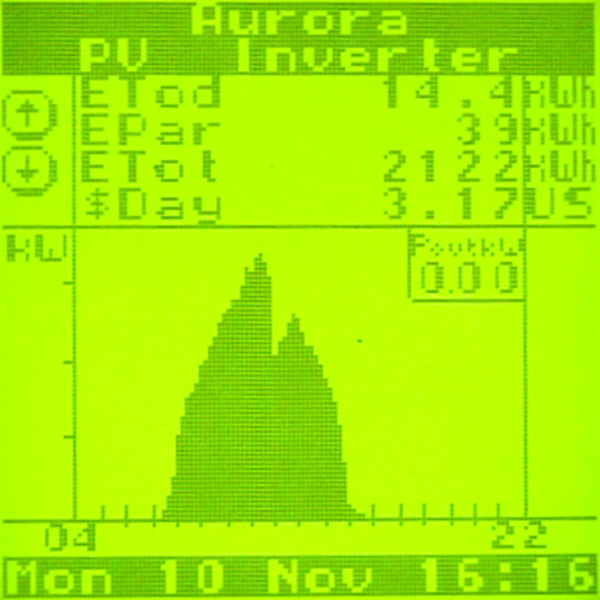
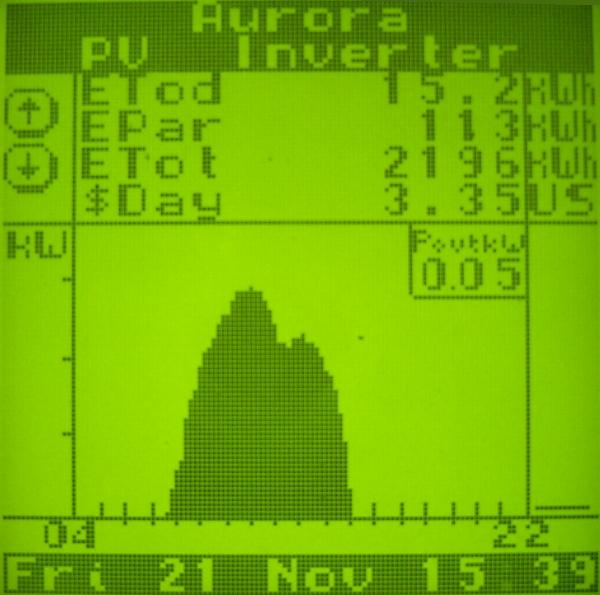
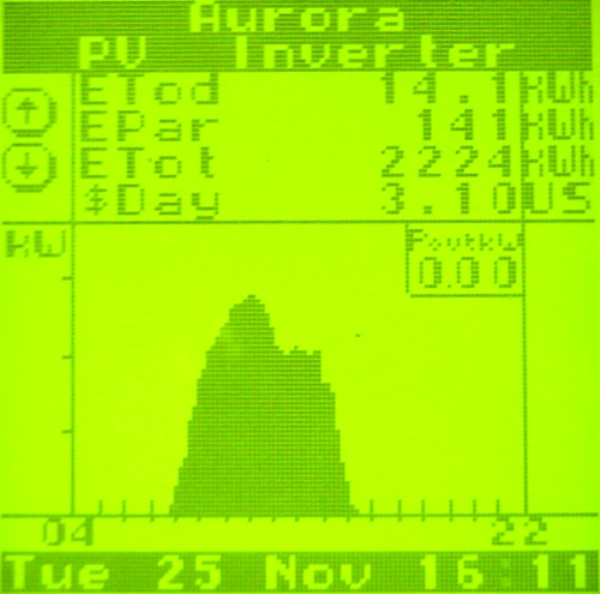
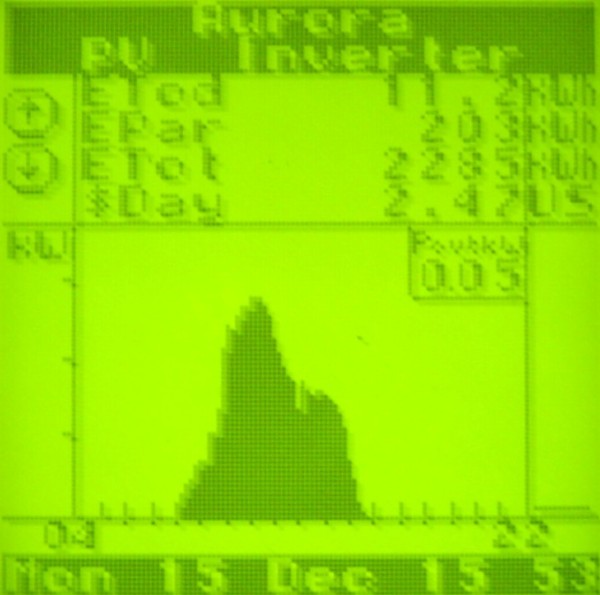
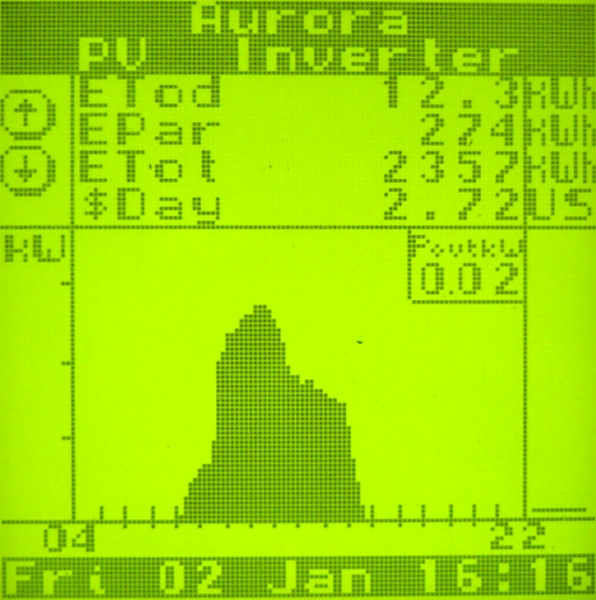
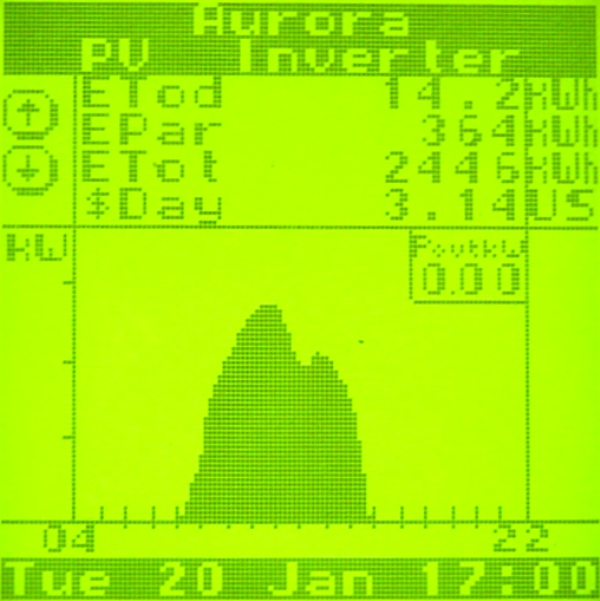
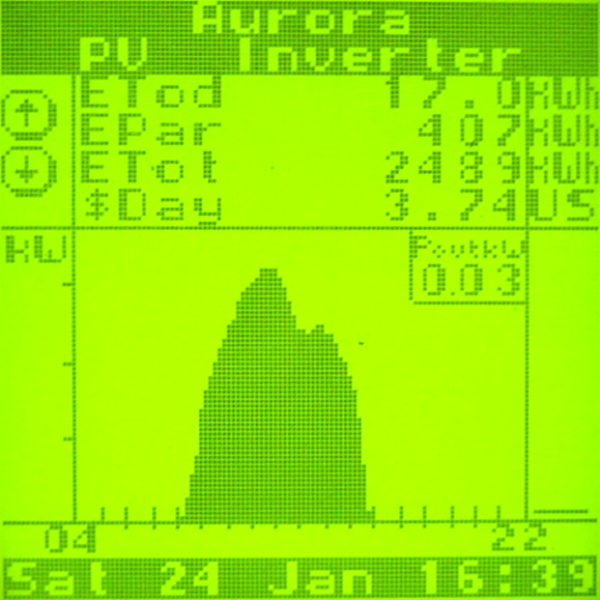
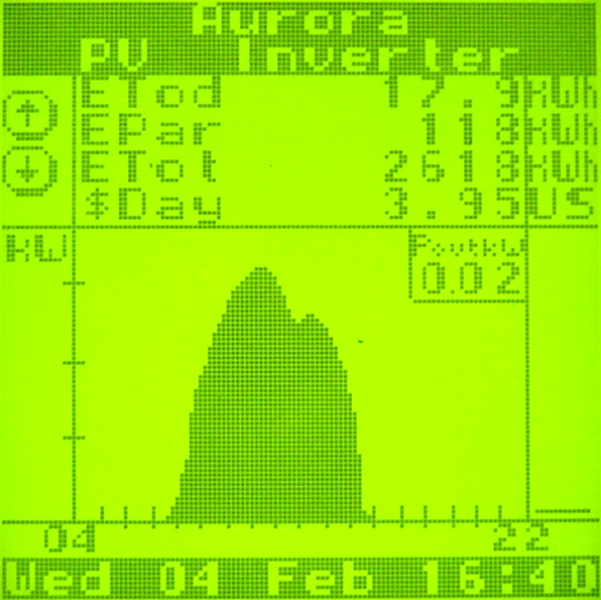
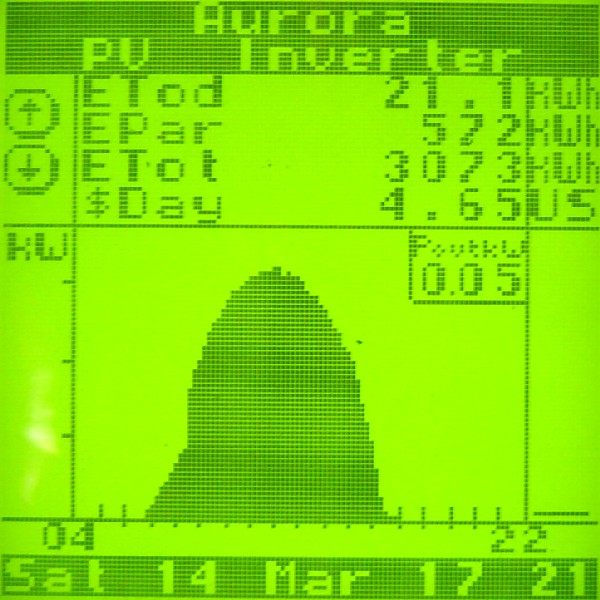
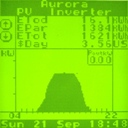
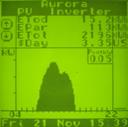
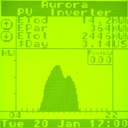
The LCD display on the inverter shows a graph of the power generated over the course of the day as a function of time. The bottom of the scale is marked in hours from 4 am to 10 pm, the left side of the scale is marked in kW from 0 to 3.6 kW, and the area under the curve is the total energy generated in kWh. If the roof received no shade, this curve would be a nice bell shape that is symmetrical about 1 pm (Daylight time) or noon (Standard time).
For comparisons of similar installations near my house see:
- The Urban Ecology Center has no shade but is tilted only about 20 degrees above horizontal (a little less than my roof).
- Curt's house has no shade from trees, but has a very similar dormer in the middle of the roof. His tilt angle is about the same as mine, and he has the same make/model of panels and inverter.
Every few weeks we have a beautifully sunny day without any clouds, so I take a picture of the LCD readout to see how the graph changes over time: (click on any of these thumbnails for a larger image)
Summer 2008
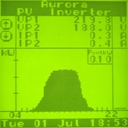
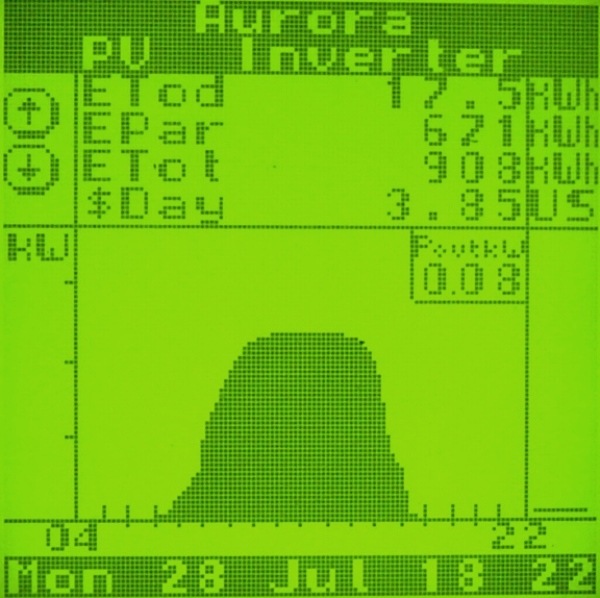
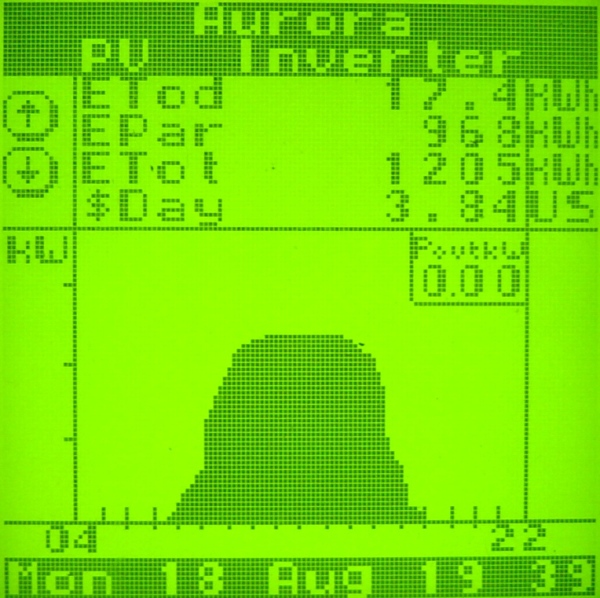
You can see two irregularities in these graphs: (1) the tops are flat (limited to about 2.4 kW), instead of having the typical peak of a bell curve, and (2) there are notches in the sides. The first problem has been investigated by Tron Melzl (a field engineer for Magnetek, the inverter manufacturer), and a potential solution is being tested over the next few months. The second problem is the expected effect of early morning and late afternoon shading. Click here for detailed analyses:
July Analysis August Analysis September Analysis.
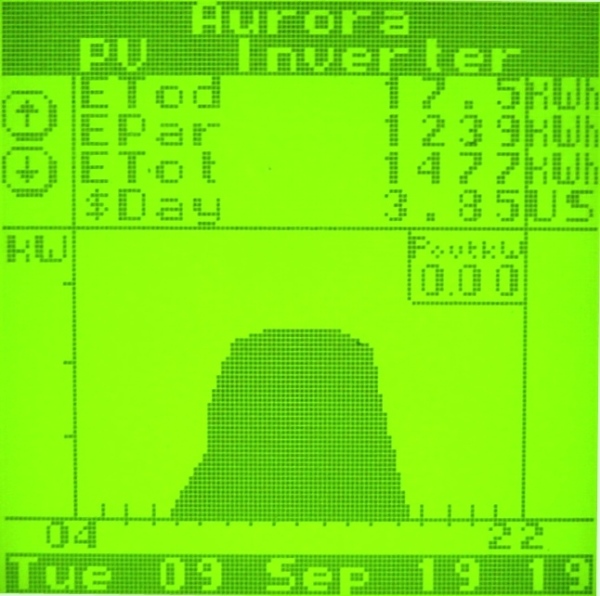
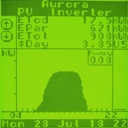
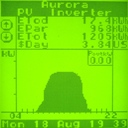
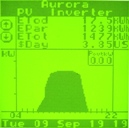
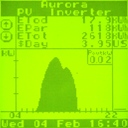
Autumn 2008
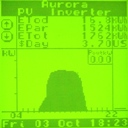
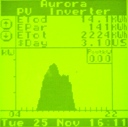
You can see the inverter calibration in early November appears to have corrected the flat-top problem; although I should wait until the more consistently sunny days of March to be sure. You can also see changes in the shading as autumn progresses: (1) the sun rises/sets farther to the south, so the dormer isn't making morning/afternoon notches, and (2) the sun is lower at noon, so the neighbor's tree (southwest of my house) is making a noticeable notch between noon and 2pm. Click here for detailed analyses: September Analysis October Analysis November Analysis.
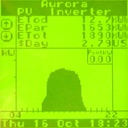
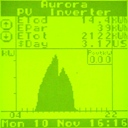
Winter 2008/2009
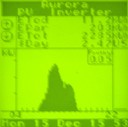
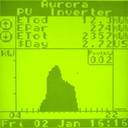

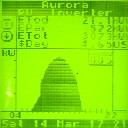
At the start of winter (sun's lowest point), the early-afternoon-tree-shading notch is more significant, and a new morning notch has appeared: the sun now rises far enough to the south that the neighbor's roof shades the bottom row of panels for a couple hours early each morning. (It's not a problem in the late afternoon, because his house is a little southeast of mine.) However, late afternoon shading has appeared from pine trees near his garage, because the sun is setting so far to the south. Later in the winter (as the sun returns northward), these notches become less noticeable. Click here for a detailed analysis: December Analysis.